I’m doing a presentation tomorrow with Jim Groom on how to create mashups without knowing anything about programming. The fun thing is it’s presented using a mashup of communist propaganda posters and that sort of rhetoric. Good clean American fun! It may, or may not, be presented entirely in a fake Russian accent. It will entirely depend on my mood (and Jim‘s).
You can also check out the full site here if you’re interested.
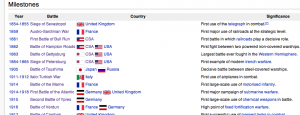
My example takes a table of information from Wikipedia on Industrial Warfare and steps you through the ways you can change it using SIMILE’s Exhibit. If you bother to look at the actual Exhibit pages you’ll see they link back to the Google spreadsheets to show you what data had to be added to create the changes on the pages.
So, you’ll start with this-

Step 1
Making this data interactive– so I cut and paste the table into Excel and clean up the data a little bit. I make the html portion of Exhibit. Then I get what’s below- an interesting level of interactivity has been added. You can select/omit/sort the data now. So seeing relationships is a lot easier.

Step 2
Adding the visual component– now I felt that we needed something more visual so I added some image URLs and URLs to the Wikipedia articles. Now we’ve got the same level of interaction but with added visual content and the ability to follow information outward.

Step 3
Adding the map– if I were fancier I’d saying “adding the geo-spatial element.” I kept the visual interface underneath the map for this one but it probably could be removed.

Step 4
This is the final step and it’s adding the data and presentation of the timeline element.

So, the whole point in this is that Exhibit is freeing the information so that you can tweak and bend and add to the information until it does exactly what you need. You don’t have to accept information the way it is. You can change it and ultimately make it far more valuable to you and your students.
Your and Jim’s knowledge of this stuff never fails to cease to amaze me. Soon they’ll be calling Centers for Teaching, Learning & Technology (CTLTs) the Centers of Tommy’s and Jimmie’s (CTJs) at colleges and Universities everywhere. Good luck with the presentation!
Very intimidating! And this is for beginners? It looks stunning, though.
$Ken – Thanks. We were practicing our bad Russian accents last night.
@woodenmask – Hopefully it won’t scare too many people, it’s really pretty pleasant once you get in there. Other than making the headers have odd curly brackets the data is pretty straight forward.
The HTML part looks scary but it’s more a matter of matching up the names you use in the data headers to match than anything else. I got a little bit fancy at times but kept it fairly vanilla.
See, you tease us Tom with the aspect of not using any code at all, but then you nail us with that bit about HTML. Now, I like to consider myself a pretty smart guy, and I’m sure it’s as easy as you make it sound once I start working with it, but there’s a LOT of teachers whose eyes will glaze over if I mentioned playing around with a little HTML. Not that it’s your fault; I just wish that the folks behind SIMILE would get around to designing some proper WYSIWYG tools like a word processor so that the regular folks could just dive right in.
Ben- You are absolutely correct. I’m hiding behind the idea that html is “simple scripting” rather than coding and this is far easier than say doing it in PHP/MySQL or something like that.
I don’t think SIMILE is too interested in the kind of simplicity that you’re talking about. They’re at such a different level in some ways that html probably seems like single digit addition. Their goal is open data formats and freeing information and I think they’re just creating display options to encourage that.
The thing is, I think we could do this on a basic level anyway. I think we could make an Excel sheet that creates the code. You wouldn’t be able to do the fancier stuff without a lot of hassle but I think it’s doable in a way similar to the way I made html for the Google Maps info windows.
If you set up the spreadsheet correctly- you’d have sheet one where you assign your column names and data types. Then through a series of text concatenations you’d end up with the code to paste into an html page. Now you could make life easier and just set up different Excel sheets based on what people wanted (just a map, just a timeline etc.) or you could make a start sheet where they select which features they want by putting a 1 in a box. That then generates the code ( through a statement like =if(a1=1,”scary_code”,””) ). If I (or preferably someone else) was really smart it’d also force you to have certain column headers that are necessary for that selection.
You could probably write all this much more easily in PHP or something like that but I don’t know that. That’s why I’m relying on stuff like this :).
Now that you’ve got it stuck in my head I might have to give it a shot.
Tom