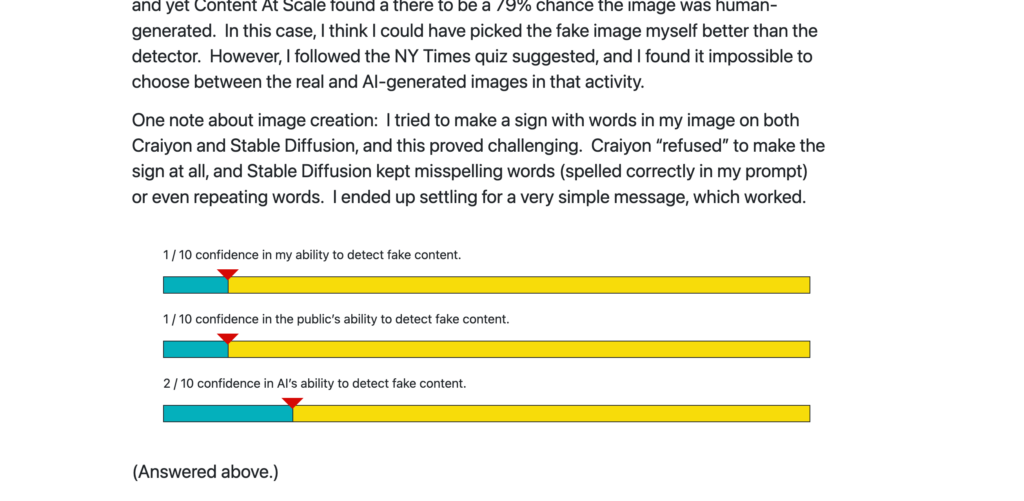
For the Detox, I’ve got a form where people will rate their confidence in a few things on a scale of 1 to 10. I thought it’d be nice to have the data presented in text and visually. That makes the resulting post a bit more polished and scannable.
Step one was to work out the HTML/CSS to make it look semi-decent. I got a little fancy<footnote>Fancy is relative.</footnote> and put a little triangle pointing at the X out of 10 intersection. You can see the HTML and CSS in the Codepen below.
See the Pen css bar chart by Tom (@twwoodward) on CodePen.
On the Gravity Forms side, I just use the merge tags to insert the ratings for each element. The HTML looks something like this. It also demonstrates why it’s a good idea to keep the main titles for your form fields short and put the details in the description area.
<div class="chart">
  <div class="rating">
    <div class="label">{How easy was it for *you* to create believable AI-generated content?:24} / 10 confidence in my own ability to create believable AI-generated content.</div>
    <div class="outer-bar">
      <div class="bar ten" style="width: {How easy was it for *you* to create believable AI-generated content?:24}0%">
      </div>
    </div>
  </div>
  <div class="rating">
    <div class="label">{How easy would you think it would be for the *general public* to create believable AI-generated content?:25} / 10 confidence in the general public's ability to create believable AI-generated content. </div>
    <div class="outer-bar">
      <div class="bar ten" style="width: {How easy would you think it would be for the *general public* to create believable AI-generated content?:25}0%"></div>
    </div>
  </div>
</div>
Then you get something like this.