
Jeff and I are doing a THAT Camp workshop that’s trying to talk about the scale/scope/potential of Google Sheets in the big box of Digital Humanities related options. Depending on how the workshop goes, I’ll revise this post to be more useful.
Getting Data In
There are quite a few ways to pull data into Google Sheets. In addition to uploading or converting csv, Excel or other fairly standard options you have a variety of internal Google Functions that will let you pull stuff in that might be useful. The sheet below demonstrates one built in import function on each sheet tab. The function is delineated in cell A1 of each sheet. These are all built in functions that are pretty straight forward.
At the other end of the spectrum, you can write your own Google Scripts to import data from APIs. Below is an example that uses the YouTube API to gather data on a variety of videos every hour.
You can see an example of this taken to the next level with Martin Hawksey’s Tags which uses the Twitter API to gather tweets and display them in pretty sophisticated ways.
Cleaning Data
Google Sheets can do quite a bit of text manipulation. It has built in functions that allow for all kinds of string manipulation in addition to some regex functionality. These things are pretty powerful but many people don’t think about Google Sheets as a place to chop up, combine, parse, or count things that are text. Once again, here are some examples of built in function of various types with varying degrees of complexity. You can also use Google Script to write your own functions when you find these to be too cumbersome or lacking in the necessary power.
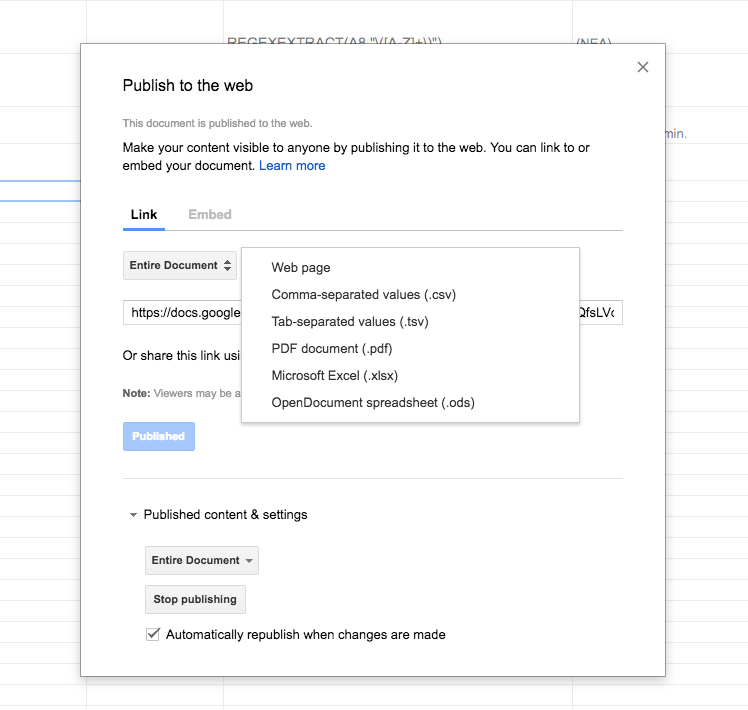
Publishing Data
Obvious publishing formats for your spreadsheets include PDF, CSV, webpage, Excel, etc.
But there are also additional options like JSON which are not seen in the GUI interface. The JSON endpoint is patterned like
https://spreadsheets.google.com/feeds/list/12WsyLvtfIPJkCXgEXsRkrI6dS0_K6brJikZqzkQa8TU/1/public/values?alt=json
Displaying Data
At the most basic level you have the option to create charts and graphs that are live linked to the data in your spreadsheet. You can publish these charts independently or embed them in other websites.
Beyond what Google offers, you have a variety of 3rd party options which help you display your Google Sheets data in more powerful and interactive ways. The two we use most frequently are Timeline JS and Awesome Table. Timeline JS is focused on timelines but is useful and powerful for a variety of digital humanities projects. Awesome Table is much broader in scope and intent and can be used in a wide variety of scenarios.
Fully Custom
With the interest and the time, you can build some pretty amazing things in Google Sheets/Scripts. I’ve built some simple display interaction that use Google Sheets JSON as the data for a Vue or JQUERY display. Jeff has built out more substantial interactions using the web app option. And recently John Stewart built out a pretty massive blogging app using Google Sheets and scripts. He details his motivation and goals in a three part series. And there’s actually a whole video interview with him if you get into it.
When is this THATcamp workshop happening? I might need to attend because this is awesome!
We did that on Friday.
I think Jeff and I are becoming a little too fascinated by all the strange things that are possible in Google land. He had a functioning API working the other morning in about 15 minutes.