As we prepare for the next theme in our MOO-ish thing, I figured I’d condense and summarize some of the products from this run.

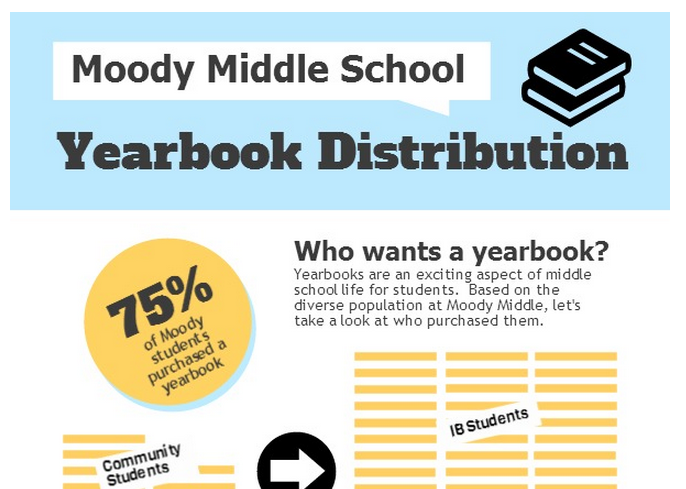
Gillian Lambert a wonderful English teacher from Moody MS opted to play along and visualized yearbook data for her school. Gillian documents the process and highlights how visualizing the information led her to new understandings. I think that’s one of the most neglected benefits of a process like this. Creating leads to additional understanding for both the audience and the author.

Debbie found that sometimes the web 2.0 tools aren’t up to par. Her critique of the infogr.am and piktochart services echoes some of the problems I’ve had with services like this over time. They are fast and relatively easy but you give up some key elements of control that some people won’t be happy about. I think they have their place but you have to go in knowing the limitations of the tool and the impact of those limitations on your ability to control the narrative.
Katie spent some time tracking happiness but with great common sense opted to move on to looking at Google Doc usage. She used mural.ly to layout the graphs from GAFE in a way that lets you see the big picture and drill down to the details. The infinite canvas concept that you have in mural.ly and prezi is something that has some fascinating possibilities.

Gaynell used her amazingly consistently entered Outlook calendar data to plot all of the yoga teaching she has done since the dawn of time. Her post does a great job breaking down how she got the data from Outlook, into Excel, and then parsed out in a way that allowed her to visualize. Her post has encouraged me to look at how I’m categorizing my calendar information so that I might actually use it. My current method is not a method.
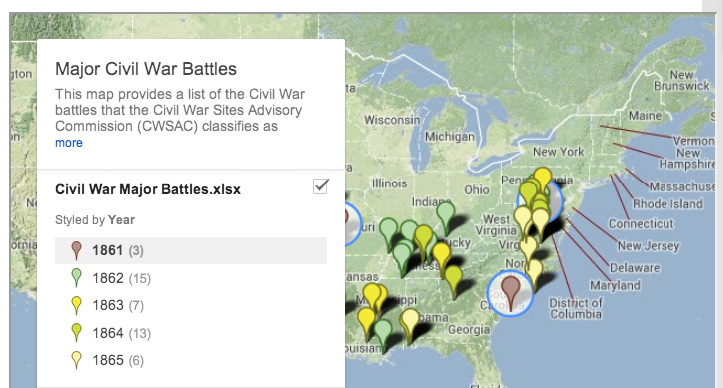
William Berry visualized data about the Civil War and used Google’s new mapping tool to do it. He got enough of my interest that I signed up for the same class he’s taking on how to build in the new Google Maps/Earth. I particularly like how he’s framing data analysis as a necessary student lens on the world. As a result of this conversation, we’re going to try playing with this same data in Exhibit.1
Karen Richardson started some work mapping where food comes from in Exhibit as well but hasn’t submitted anything officially. I’m linking her in anyway. I’ll also be working some in the near future to update my Exhibit tutorials. If you feel like time traveling the old tutorials from around 2007 are here. iWeb anyone?
None of this was massive but I’m really happy that people have participated and have enjoyed things. The next round will likely be focused on the idea of remix (defining post coming soon). It’s a big topic and the Internet is a big place. You’re more than welcome to come join us.
1 I may over advocate for this tool but it remains uniquely capable of visualizing information over time and space in a fluid faceted user friendly environment.
Sorry about the unofficial part…Tom has the link right for my attempt at data viz. My biggest problem was finding the data as there didn’t seem to be an already compiled list of the information I was looking for in terms of number one producers for certain food items. I’ll keep adding as I have time to research. I did find Exhibit pretty easy to use. I checked out Tom’s tutorials, and then started with an example that allowed me to download and manipulate already created files. Here’s the link to the sample map I started with: http://www.simile-widgets.org/exhibit/examples/flags/flags.html. In my mind, there’s a blog post about the skills required to pull this off that range from digital image editing to conducting efficient Internet research. I’d be happy to help with the Civil War map.