
creative commons licensed ( BY ) flickr photo shared by Dmitry Baranovskiy
We have a few people messing about with JavaScript for the first time1 so I figured I’d sketch out how I use Chrome to help debug things. With Chrome it’s relatively pleasant.
Chrome has developer tools which are very handy for all things made on the web. They’re even so kind as to provide really extensive advice on using these tools to troubleshoot JavaScript. I’d suggest going there if you’re serious but the pattern described below is far more efficient than my previous technique- which mainly consisted of mumbling curses while squinting very hard at the screen.
My technique is essential this-
Something is broken. With JavaScript this will often just result in a blank space. Typos will kill you. JavaScript is case sensitive.
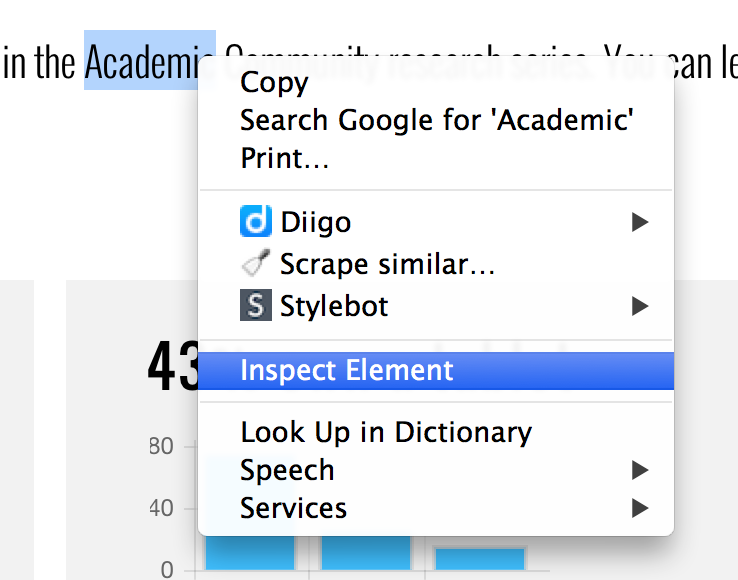
I right click/ctrl click and choose inspect element.

Then I move over to the Console view. It will have bright red warnings about my failure to match things up.

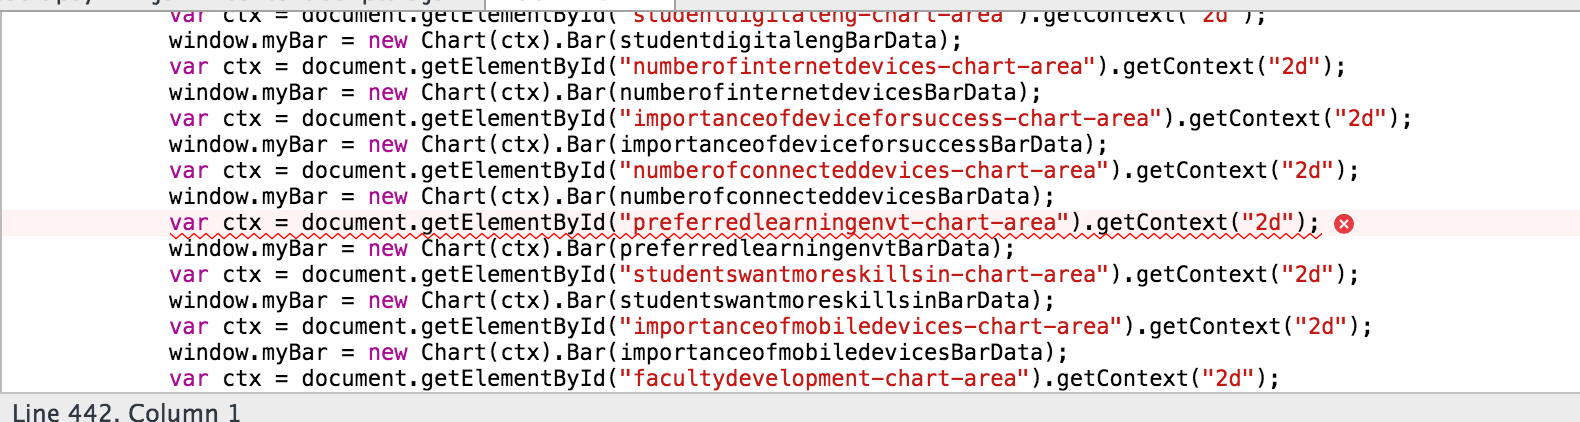
From there I can click on the far right and shift to my actual code (the Sources screen) at the place where the issue is occurring. In this case the problem is that it references a div that doesn’t exist.
1 I’m pretty much in that same cohort.
I was also squinting on my small lo-res monitor screen. But I tried using Firefox’s developer tools which were far too complex and unhelpful. I wonder if coding them one chart at a time and checking it on a browser might be more helpful than writing a whole chunk and trying to see if the errors are hidden somewhere? I was also itching to not just edit the code but also Stan’s interpretation of the statistics I had written on the Google Doc headers and labels etc. It became too overwhelming for me to edit. Novice mindset.
Good point and one I neglected to say explicitly. I do things a chunk at a time and make sure each step works. It is a far better path.
Note to self: do few charts at a time and check if it works thanks for the tip