I’ve long wanted to build more interactive digital content after being inspired by Brett Victor’s explorable explanations. I’m now finally coming to the place where my ability to build things is starting to match my desire to create them.
This particular piece of interactive content was inspired by the NYT’s You Draw It Obama article. We did a direct imitation with carbon sequestration a while ago but I liked the broader concept of guessing at something and then being presented with data. In this case we’re trying to get people to think a little harder about the good things they got out of life just by being born.

Form Tweaking
First I wanted to tweak the gravity form layout. Given our first question was a placement on a scale of -10 to 10, that content needed to be arranged horizontally. This is Gravity Forms and the radio button input type. So I copied the HTML into a codepen to play with it. This is the result.
See the Pen
gform layout by Tom (@twwoodward)
on CodePen.
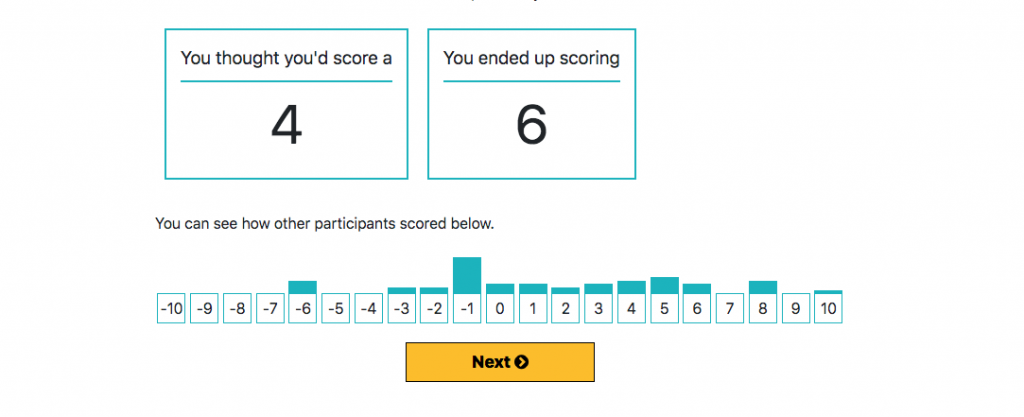
Results Display
Another pattern I find myself repeating is roughing out the data display portion in Codepen. I can then figure out how I need Gravity Forms/WordPress to pass the data live but it’s easier to build out the experience a bit without worrying about getting live data. Isolate your variables and gradually add complexity.
In the codepen below you can see that scores are set manually for the demo. The function goes through each score and gets the div with the same ID. It also increments the data-count +1 each time it cycles through. That allows me to set an inline CSS style for border-top to be the data-count * 8.5 (or whatever looks good). Once we have enough entries we can tone this down but prest-o change-o a bar chart using nothing but thick borders.
let scores = ['pos-1', 'pos-1', 'pos-3','neg-2','pos-1', 'pos-1', 'pos-3','neg-2', 'neg-10','neg-10','neg-10','neg-10','neg-10','neg-10','neg-10','neg-10','pos-7']

countThem(scores)
function countThem(scores){
  scores.forEach(function(score){
    let bubble = document.getElementById(score);
    console.log(bubble)
    let count = parseInt(bubble.getAttribute('data-count'),10);
    count = count+1;
    bubble.setAttribute('data-count', count);
    bubble.setAttribute('style', 'border-top:' + (count*8.5) + 'px solid #00b3be;');
  })
}
<div class="bubble-holder" id="bubble-zone">
    <div class="bubble" id="neg-10" data-count="0">-10</div>
    <div class="bubble" id="neg-9" data-count="0">-9</div>
    <div class="bubble" id="neg-8" data-count="0">-8</div>
    <div class="bubble" id="neg-7" data-count="0">-7</div>
    <div class="bubble" id="neg-6" data-count="1">-6</div>
    <div class="bubble" id="neg-5" data-count="0">-5</div>
    <div class="bubble" id="neg-4" data-count="0">-4</div>
    <div class="bubble" id="neg-3" data-count="2">-3</div>
    <div class="bubble" id="neg-2" data-count="1">-2</div>
    <div class="bubble" id="neg-1" data-count="11">-1</div>
    <div class="bubble" id="zero-0" data-count="1">0</div>
    <div class="bubble" id="pos-1" data-count="3">1</div>
    <div class="bubble" id="pos-2" data-count="0">2</div>
    <div class="bubble" id="pos-3" data-count="3">3</div>
    <div class="bubble" id="pos-4" data-count="0">4</div>
    <div class="bubble" id="pos-5" data-count="5" >5</div>
    <div class="bubble" id="pos-6" data-count="0">6</div>
    <div class="bubble" id="pos-7" data-count="0">7</div>
    <div class="bubble" id="pos-8" data-count="0">8</div>
    <div class="bubble" id="pos-9" data-count="0">9</div>
    <div class="bubble" id="pos-10" data-count="0">10</div>
  </div>
See the Pen
bubblish chart exploration by Tom (@twwoodward)
on CodePen.
WordPress/Gravity Forms Land
Now to get the live data and integrate it all. This function gets the Gravity Form entries and creates the data structure we need to pass on to the javascript.
function gform_stepper($entry, $form){
   $search_criteria = array(
    'status'        => 'active',
);

  $sorting         = array();
  $paging          = array( 'offset' => 0, 'page_size' => 100 );//getting most recent 100 right now
  $total_count     = 0;

  $entries = GFAPI::get_entries(4, $search_criteria, $sorting, $paging, $total_count );
  $html = '';
  $total_scores = [];
  $total_guesses = [];
    foreach ($entries as $entry) {
      if (intval($entry['gsurvey_score'])>0){
        $pre = 'pos-';//add pos if greater than 0
      }
      if (intval($entry['gsurvey_score'])<0){
        $pre = 'neg';//add neg if less than 0
      }
      if (intval($entry['gsurvey_score']) === 0) {
        $pre = 'zero-';
      }
      array_push($total_scores,$pre . $entry['gsurvey_score']);
      $guess = array_push($total_guesses, $entry[3]);
    }
      $gform_scores = array(
           'scores' => $total_scores,
       );
     wp_localize_script('main-course', 'gformScores', $gform_scores); //sends data to script as variable
}
let scores = gformScores.scores;//THIS IS THE VARIABLE PASSED via localize
countThem(scores)
function countThem(scores){

  scores.forEach(function(score){
    let bubble = document.getElementById(score);
    console.log(bubble)
    let count = parseInt(bubble.getAttribute('data-count'),10);
    count = count+1;
    bubble.setAttribute('data-count', count);
    bubble.setAttribute('style', 'border-top:' + (Math.ceil(count*3.5)) + 'px solid rgba(0, 179, 190,1);');
  })
}
The result is a form that you can submit and get results like you see below. Just the beginning of things but a step in the right direction I think.
