All right. So I didn’t win Dan’s design challenge. Iain’s report and a number of others had both more information and more story than mine. But the contest has led to some more thinking and some action.
Feeds
All my feeds are now in Google Reader. Now I get stats.
That led me to realize I read (scanned, processed, whatever) 1,128 posts last Friday. I’m averaging about 600 a day. That seems excessive especially considering that 90% are read between 9:00 PM and 11:00 PM. So I looked at the top feeds by number of posts per day and saw the top one was a Yahoo Pipes mashup of digg, del.icio.us, reddit, and Slashdot. It was something like 250+ posts a day. Way too much noise compared to real value. Cut it. I also dropped Gizomodo (12 posts a day) and am looking at pruning more feeds.
Hopefully this isn’t coming across as a #11 on Pete’s list of common edtech blog posts. I’m not overloaded. I’m just looking to be a little more efficient and am using data to help me make those judgments.
Annual Report
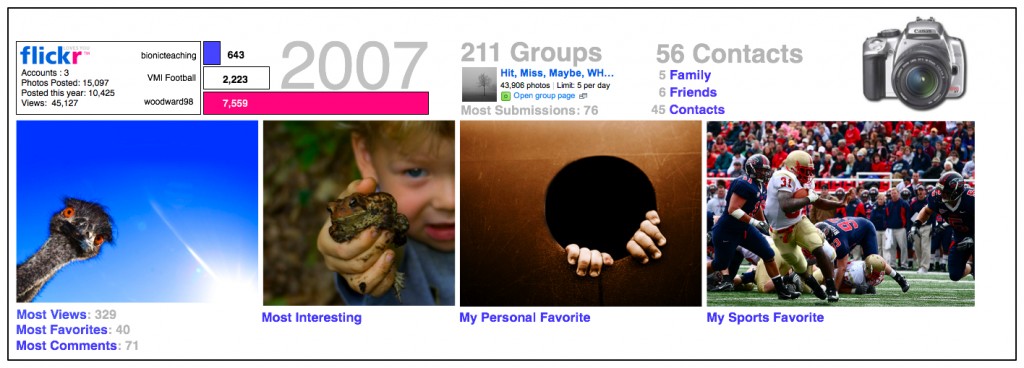
I’ve been thinking about my submission for the annual report and realize I did a few things wrong. I liked what I did. It was pretty. However, it was really more about looking cool than providing information and a story. So I’m going back and rethinking how I did things.
I’ve remade the flickr data with an eye towards showing additional data. I’m still not thrilled with it but it’s getting closer.
