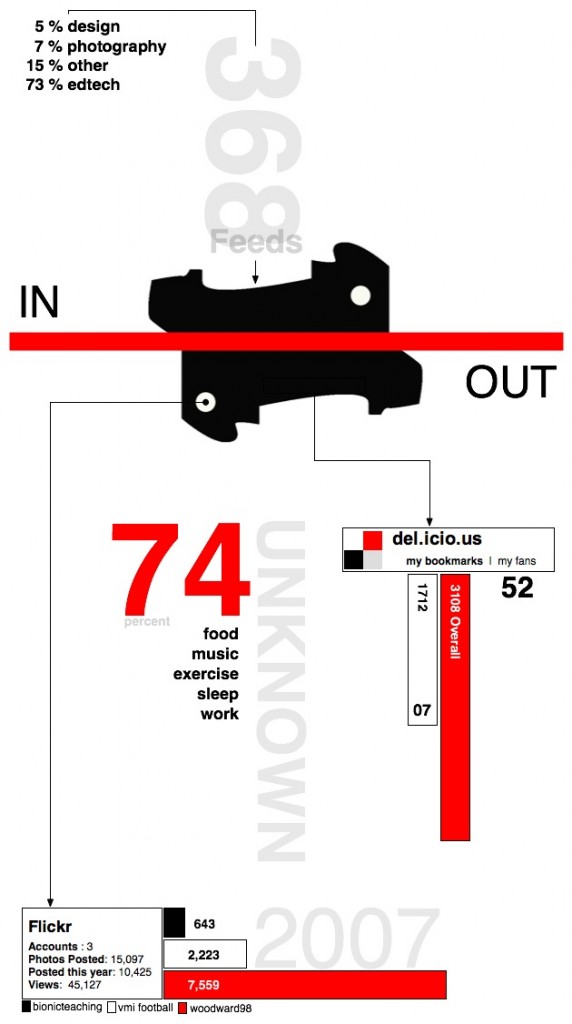
I’m bouncing Dan’s post about design and storytelling in my head. His basic message is that it’s all about the story and design is just a tool to convey the story. If two people are telling the same story, the one who knows when and how long to pause, when to raise their voice, when […]
Category: Data Visualization
2007 Reviewed
I took Dan’s challenge to explore my 2007 via design. The whole thing really intrigued me. I was amazed by how little I track what I do and, often, how little access I could get to my own data (which I know the companies are tracking). I really wanted better stats once I got going. […]
Meet the World – Information and Graphics
Grand Reportagem magazine (can’t find a link- it’s from Portugal) has an interesting series of info graphics (you can see them here) that illustrating fairly disturbing facts about countries- using the flags of the countries. Interesting idea- using symbols of pride to criticize/inform. You could also do something similar with many logos (companies, sports, universities). […]
Maps of War
Maps of War is a fascinating site of animated maps showing the history of conflict in our world. They include a history of war and leadership (seen above) that walks through American conflicts and links the American President to various wars, a history of religious conquest throughout the world, and an interesting history of imperial […]
Wikipedia Mindmap – more data visualization!
Wiki Mind Map.org This is a really cool free site that’d be great to use in the classroom. You pick a topic from wikipedia and it creates an interactive mind map of the content. Click on the pluses and topics expand. You can even change the “center” topic of the map on the fly. Lots […]
Read More… from Wikipedia Mindmap – more data visualization!